


Reading trading charts is a fundamental skill for anyone involved in financial markets. Whether trading stocks, commodities, forex, or cryptocurrencies, charts provide a visual representation of price movements over time. They help traders analyze market behavior, identify trends, and make informed decisions. While charts may seem complex at first, understanding their basics can greatly improve trading confidence and accuracy.
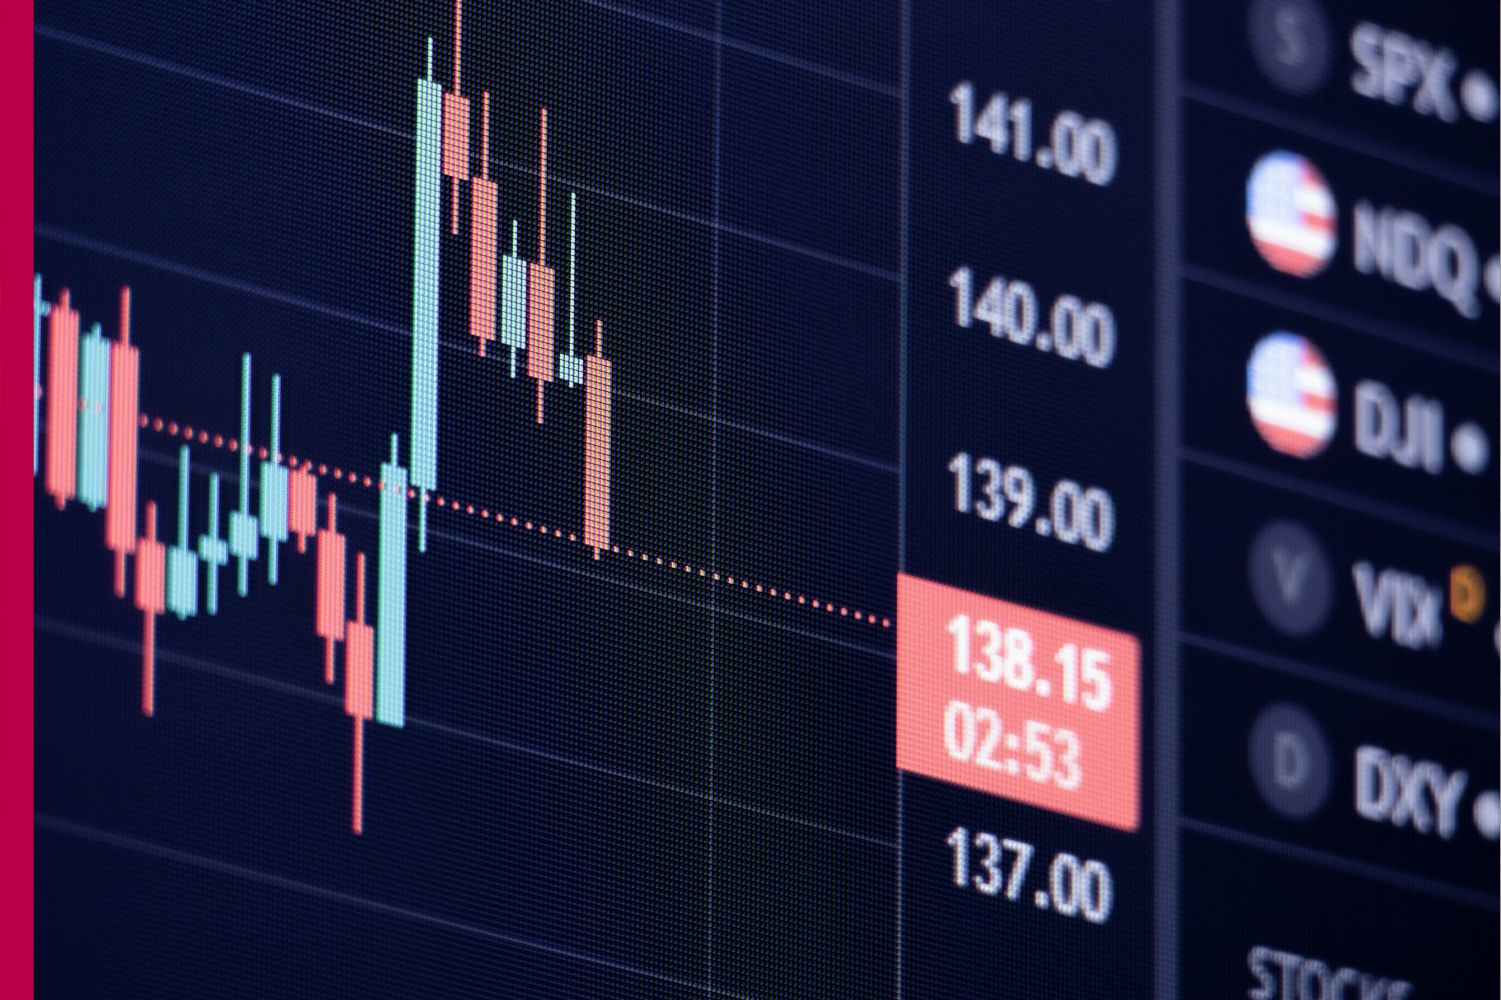
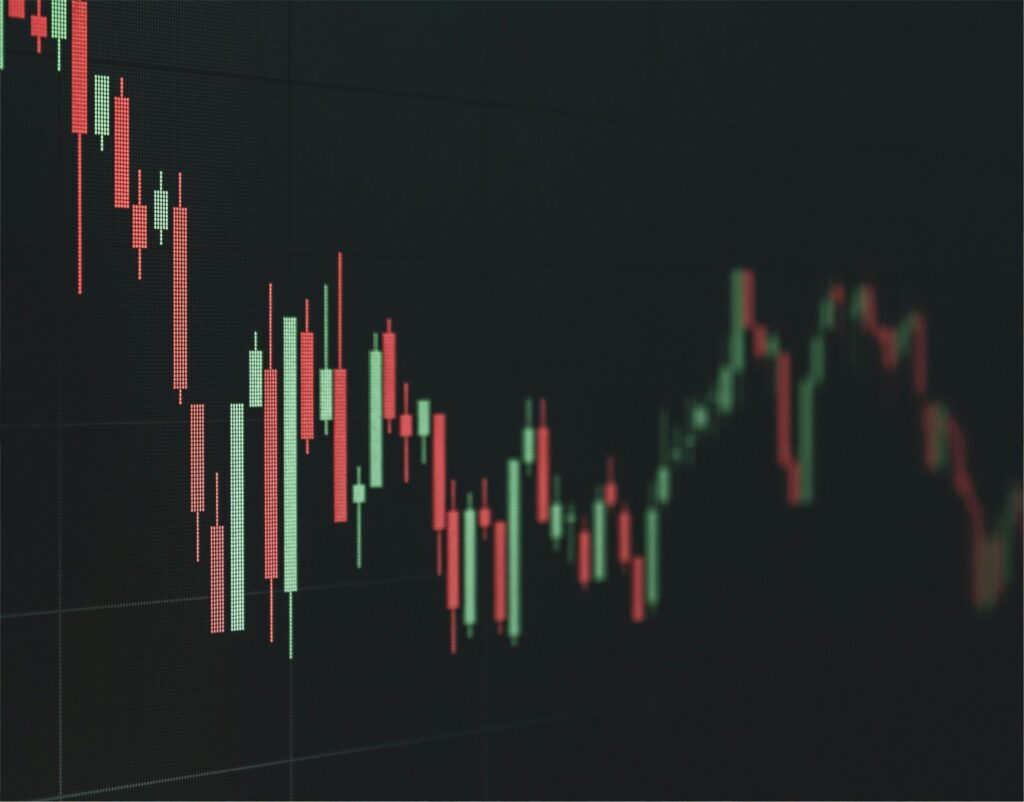
Trading charts display price data using different formats, the most common being line charts, bar charts, and candlestick charts. Line charts show the closing price over a selected period, offering a simple view of overall trends. Bar charts provide more detailed information, including opening, closing, high, and low prices. Candlestick charts are the most popular among traders because they visually highlight price movement, momentum, and market sentiment through color-coded “candles.”
Time frames are an important aspect of reading trading charts. Charts can represent price action over minutes, hours, days, weeks, or even years. Shorter time frames are often used by day traders to capture quick price movements, while longer time frames help investors understand broader market trends. Choosing the right time frame depends on trading goals, strategy, and risk tolerance.
One of the key elements in chart reading is identifying trends. A market can move upward, downward, or sideways. An uptrend is marked by higher highs and higher lows, indicating buying strength. A downtrend shows lower highs and lower lows, reflecting selling pressure. Sideways markets move within a range and suggest indecision. Recognizing trends helps traders align their strategies with market direction.
Support and resistance levels are also crucial in chart analysis. Support is a price level where buying interest tends to prevent prices from falling further. Resistance is a level where selling pressure often limits upward movement. These levels act as psychological barriers and help traders plan entry and exit points. When price breaks through support or resistance, it often signals a potential change in trend.
Indicators and patterns further enhance chart analysis. Moving averages smooth out price data to reveal trend direction. Volume indicators show the strength behind price movements. Chart patterns such as triangles, head and shoulders, and double tops or bottoms provide clues about potential future price behavior. While indicators are helpful, they should be used alongside price action rather than alone.
Reading trading charts also requires discipline and patience. Markets can be unpredictable, and no chart guarantees success. Risk management, such as setting stop-loss levels and controlling position size, is essential to protect capital. Continuous learning and practice improve chart-reading skills over time.
In conclusion, reading trading charts is both an art and a science. It combines technical knowledge with observation and experience. By understanding chart types, trends, support and resistance, and key indicators, traders can better interpret market signals. With consistent practice and disciplined decision-making, chart reading becomes a powerful tool for navigating financial markets confidently.